The Client
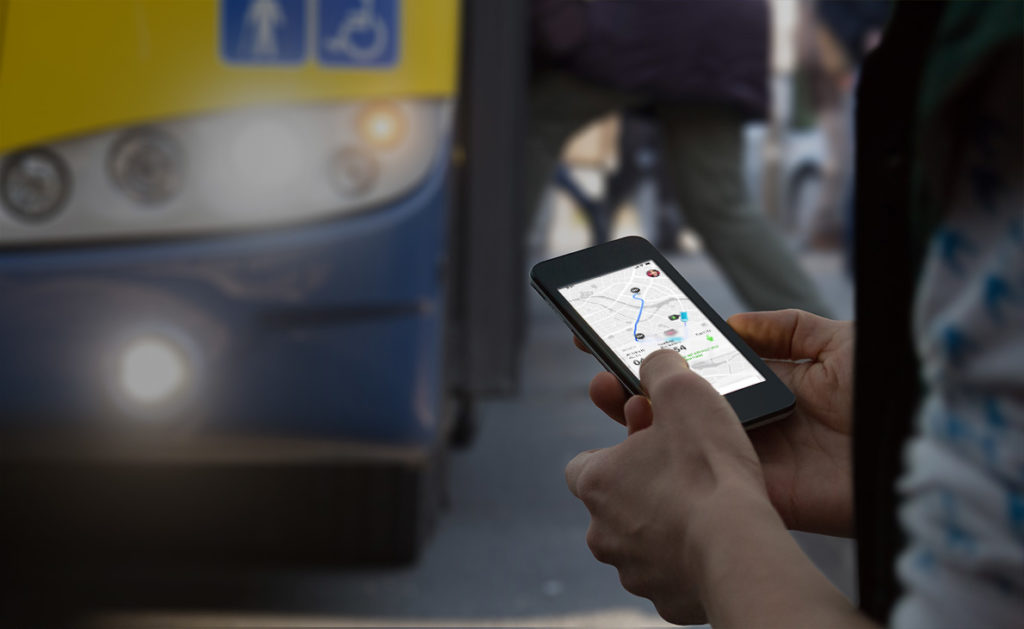
The bus transport network for CITY (name redacted) is a private operator working for the local government, providing staff and buses for the public transport sector. The CLIENT (name redacted) has a mobile app where its users can view the buses that attend a certain bus stop, the waiting time for the next bus, and the travel route of that bus.
The Problem
The global COVID-19 pandemic has shown that (in between other things) social distancing is needed to reduce transmission in the population. To help with social distancing on public transport, initially the government within CITY initially declared that buses would have reduced capacity and that certain seats would be “made unavailable” to comply with the 2 meters distancing rule.
While this solution was plausible during the height of the pandemic, with the gradual reduction of public measures and the start of recovery and “back to work” phases, bus capacity had to return to previous levels. This presented another issue as the virus still exists and can still infect even vaccinated people.
At the moment, bus drivers use their own better judgment to analyse the available space within their bus and make an executive decision to whether they will allow new passengers onboard at the stops, which generates frustration on behalf of users who need to take a bus and are unaware of how long the journey will take them as it is uncertain if they will be able to hop onto the next available bus.
Our team was hired to tackle the problem of users not knowing:
- if the next arriving bus is at capacity or not;
- if so, when will the next bus that is under capacity;
- how long the reviewed journey will take;
- and how traffic during rush-hour would affect the users journey time.
While expanding the current fleet of 8,500 buses would only add more traffic to the already congested city and modifying the layout of the streets would be impossibly expensive, a solution must be found to make the commute safer.
Problem Statement
How might we help users avoid crowded buses while still getting them to their destination in time?
The Research
Analysing the poll conducted by CLIENT, our team was able to note that satisfaction regarding the bus capacity (i.e. how many seats are available and if there is enough comfortable standing space) is at 3.6 points out of 5 points, and waiting time satisfaction (i.e. the amount of time a person must wait at a bus stop) is at 4.2 points out of 5 points – all pre-pandemic – which led us to realise solving this problem would not only benefit the CLIENT during the COVID-19 crisis, but also after. Yet these numbers are only true during off-peak hours. During rush hour the satisfaction regarding capacity and wait time is at 0.2 and 1.4 respectively.
This indicates that, overall, the problem lays not with the physical bus itself or how many are available.
According to a research published by Trinity College in Dublin [1]:
Commute satisfaction levels among public transport users were found to decrease for those who travel on crowded or unreliable services and those who have long wait-times
Another study published on the Journal of Transport Reviews [2] has shown an impact on mental health that commuting has on individuals by reviewing the commuting experience itself, including attitudes towards it and the use of time during the journey. It concludes by highlighting the increase of mental health issues when transport planning and policy are lacklustre within a city.
We hypothesised that if it were possible to reduce the crowdedness of buses and make the timing more reliable, satisfaction would increase even if the transit time doesn’t. This would also have the added benefit of making the transportation more secure.
The Persona
After analysing the data of people who have taken the poll, we were able to craft a persona which whom we would be empathise with and better define the problem as well as use as a marker to test the solution.
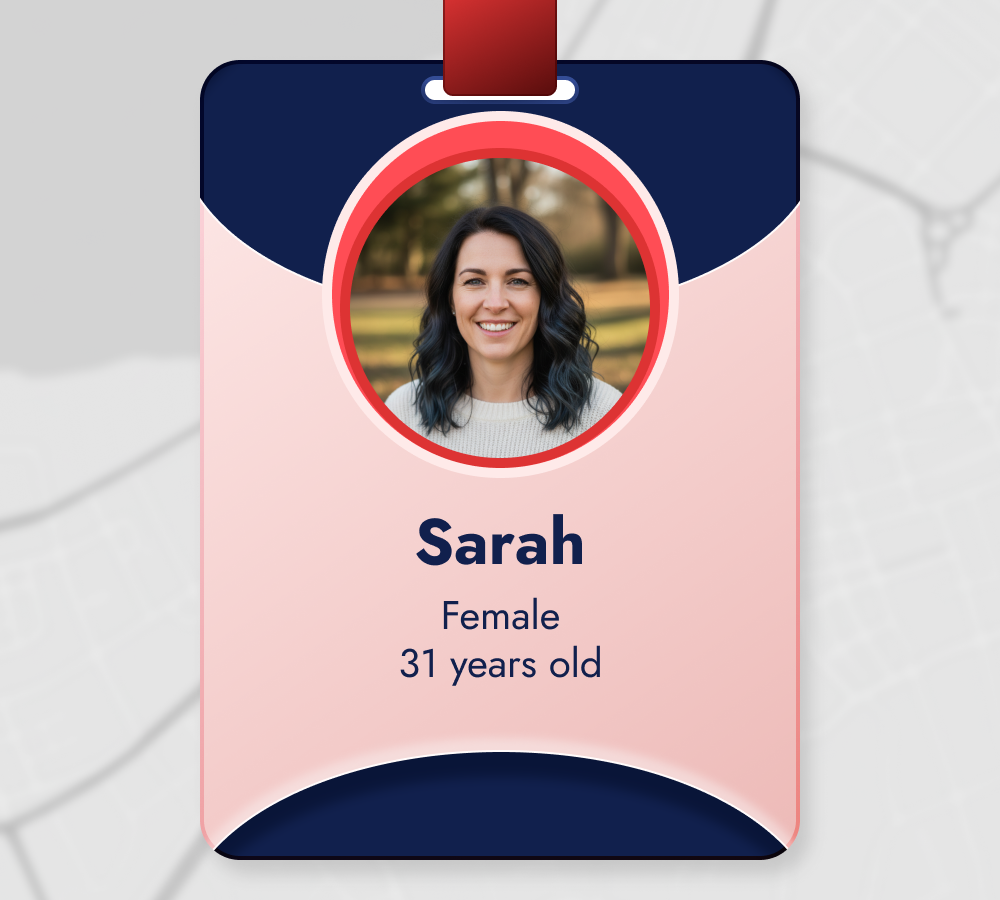
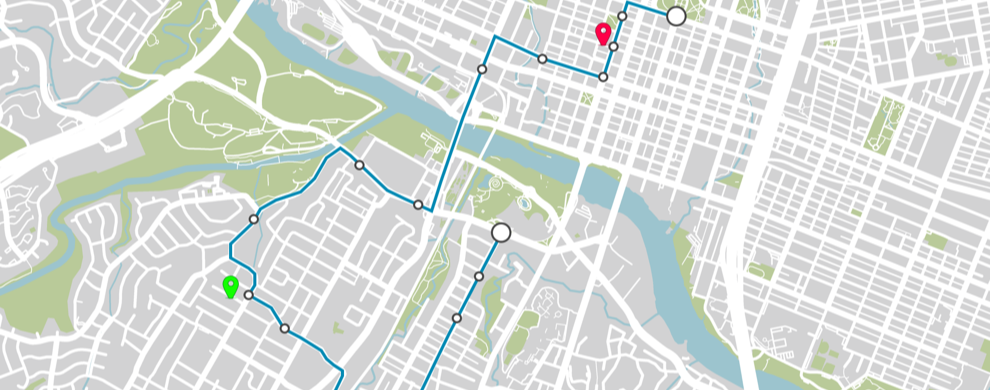
Sarah is a young, single, independent woman who works for a private company in the main business district while living in a residential area about 3.5 KM away.
Like many her age, she is tech-savvy and uses her smartphone often. Sarah is also time-conscious and uses the CLIENT mobile app to know when the next bus is approaching the nearest bus stop (300 meters from her house).
While her work day begins at 9:30 AM and her house is typically a 15 minute drive away, she must leave home by 8:40 AM to arrive after a 40 minute commute at 9:20 AM. The delayed commute time and full bus often has an adverse on Sarah’s mood in the morning and on her way back home in the evening.
The Challenge
Based on the persona generated, the team was able to define that the problem lay on not knowing which bus is overcrowded or if there is a better alternative time to catch a transport that wouldn’t be stuck in traffic and still arrive within a certain timeframe.
Further Research
As CLIENT maintains diligent analytical data, we were able to retrieve the following data for an existing bus route that our persona would take on a specific date:
- Location of bus stops
- Time bus leaves terminal
- Scheduled time to arrive at any given bus stop
- Actual time arrived at any given stop
- Amount of transport card tag-ins (user boarding) at any given stop
- Amount of tag-outs (user alighting) at any given stop
We were also able to retrieve data on roads with high influx of traffic during certain periods of the day (rush hour) and how it affects the average travel time.
We focused our efforts on 7 buses that attend the same route, leaving at 15 minutes intervals from the terminal – with extra buses leaving at 5 minute intervals from 8:30 AM to 8:45 AM.
The Findings
With our further research and defined focus, we were able to create a heat map of tag-ins and tag-outs during a specific time period on buses that were attending to a specific route (Route 16).
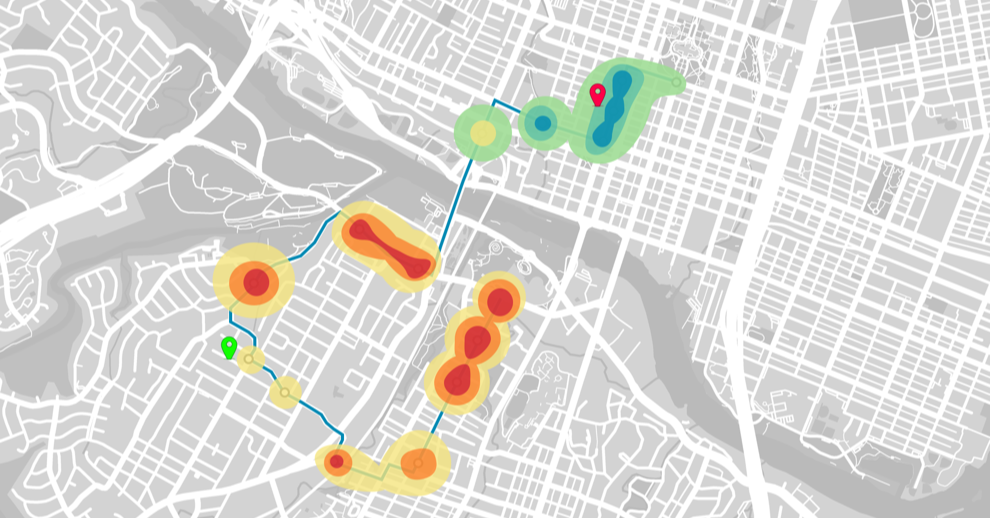
We then retrieved the average traffic load on the streets accessed by Route 16 from 08:00 to 09:00, Monday to Friday during a 6 month period. This data was captured by Google Maps, Traffic API [3].
By analysing the clients analytical data, we were able to track the times of all 7 buses attending the route during the one hour period (08:00 – 09:00). While buses would leave the terminal at exact times and there was no set time to reach specific stops, there was still a schedule of arrival in place and data on the actual time of arrival. We then calculated the time in transit and the delay resulting from traffic congestion.
At this point, we were able to cross-reference all data points and come up with an estimate on the bus capacity load by the time it arrived at a specific stop (i.e. Sarah’s stop).
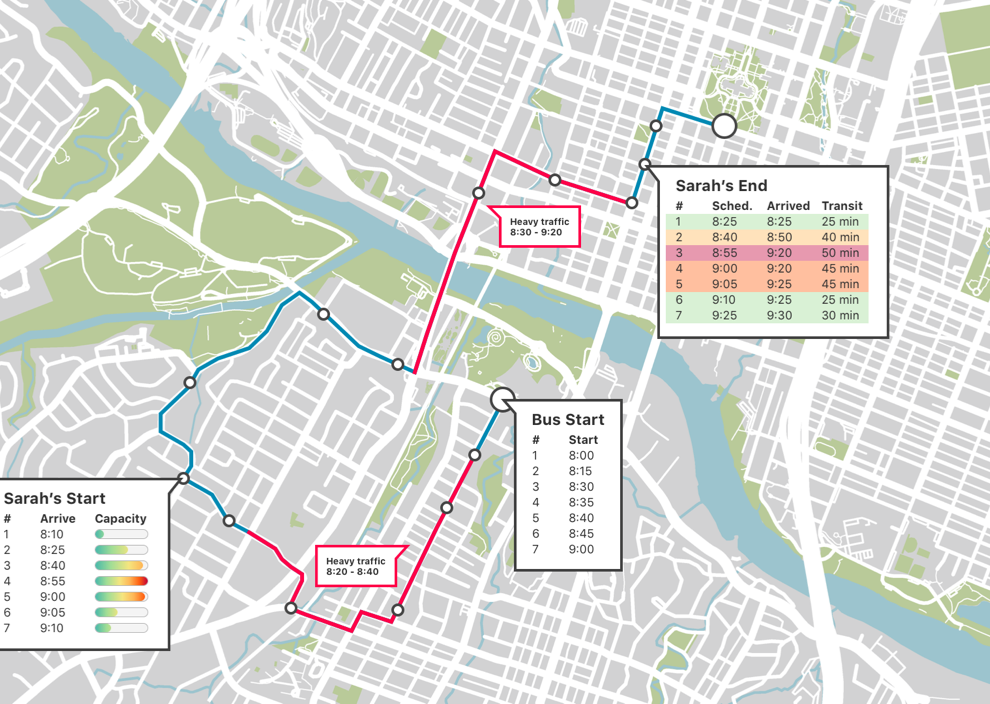
With the estimation on bus capacity and arrival time (adjusted for delay due to traffic conditions), we were able to show that Sarah was currently taking the #3 bus which would arrive at almost full capacity, spending 50 minutes in transit, and arriving at her stop at 9:20.
Generating all the data points, we discovered that if Sarah would take bus #6 (arriving at her starting point at 9:05), she would be boarding an almost empty bus and arriving only 5 minutes later than her norm while only spending 25 minutes in transit.
As we know how long it takes Sarah to get to her bus stop from her home, we are able to send a push notification at 8:55 reminding her to leave within the next 5 minutes (9:00) and walk the 300 meters (3 minutes) to catch the bus at 9:05.
By reducing Sarah’s time in transit by 50% while only giving her a 5 minutes delay on arrival (while still being within her maximum arrival time of 9:30) and a mostly empty bus, we are confident this would be the best solution to our clients problem.
The Wireframe
The following steps are to set a destination and arrival time.
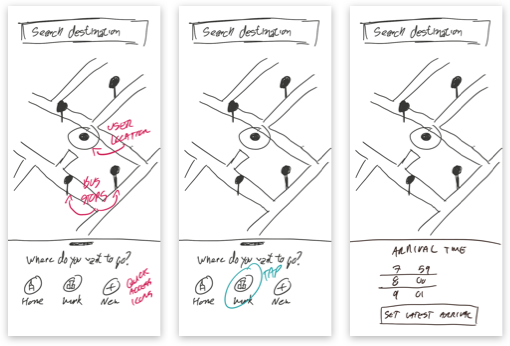
Step 1: User can view their location and nearest bus stops. At this point, they already have set up their home and work addresses as “shortcuts”
Step 2: User taps the “Work” shortcut
Step 3: User selects latest arrival time (i.e. “I have to be at work by 08:00”).
Next steps: App would suggest which bus to take and at which bus stop to take it from.
On the the following screens, the user can view more information.
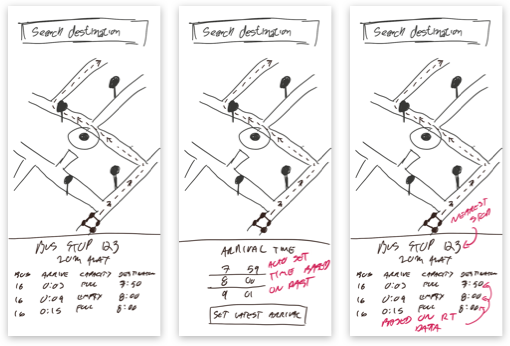
Screen 1: User can tap on a nearby bus stop to view the arrival schedules of all buses attending that stop. It would also be able to calculate the capacity the bus would arrive at.
Screen 2: When selecting a destination, the app would be able to suggest an arrival time based on past usage
Screen 3: Same as screen 1 with further information.
The Prototype
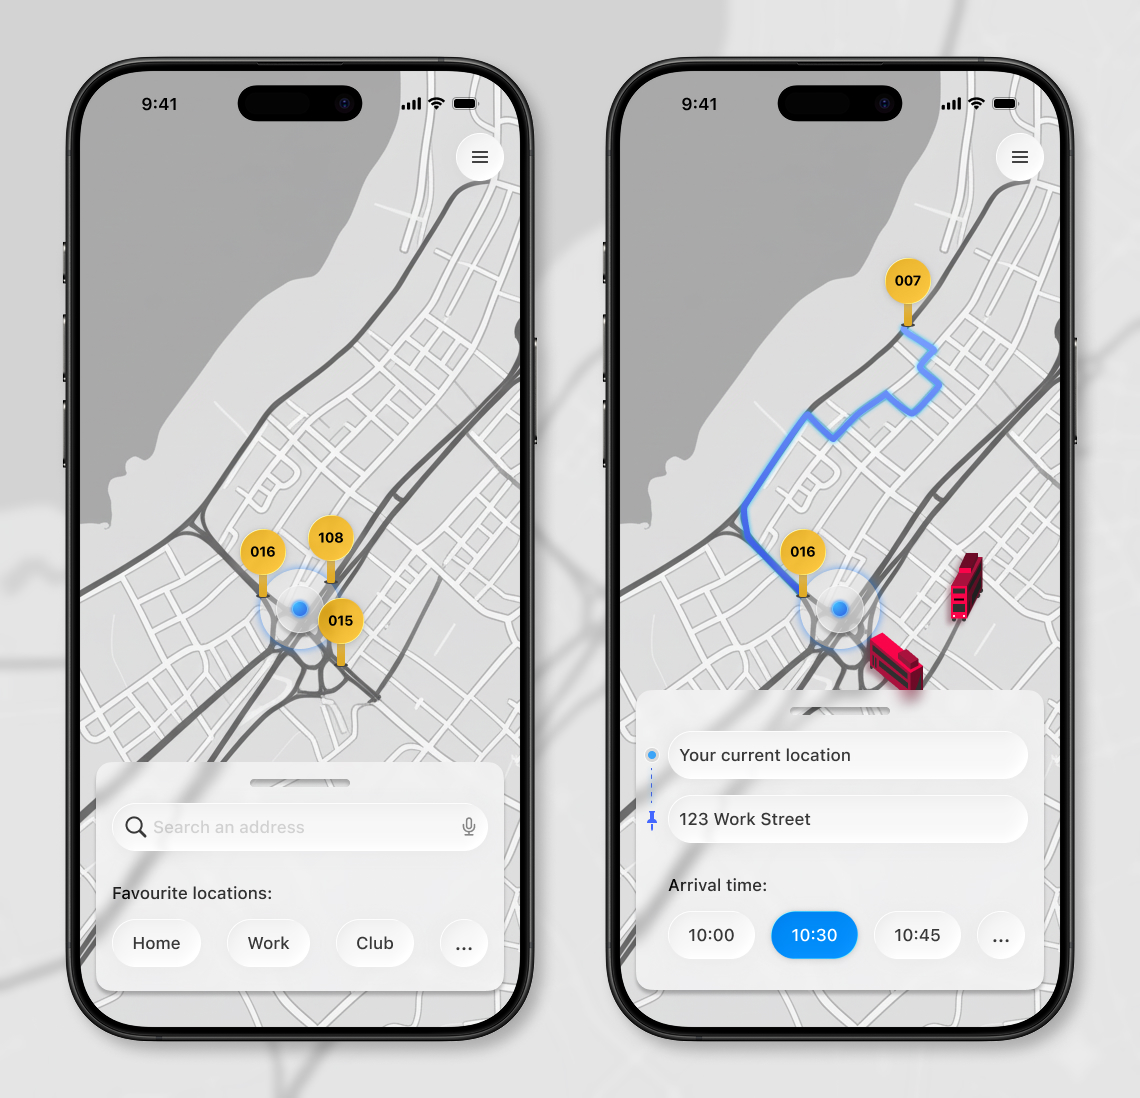
Screen 1 (left): Users home screen, showing nearby stops and favourited routes (bottom) as well as search input box
Screen 2 (right): After user has selected destination, user can select preferred arrival time, with nearby buses going that route already being displayed.
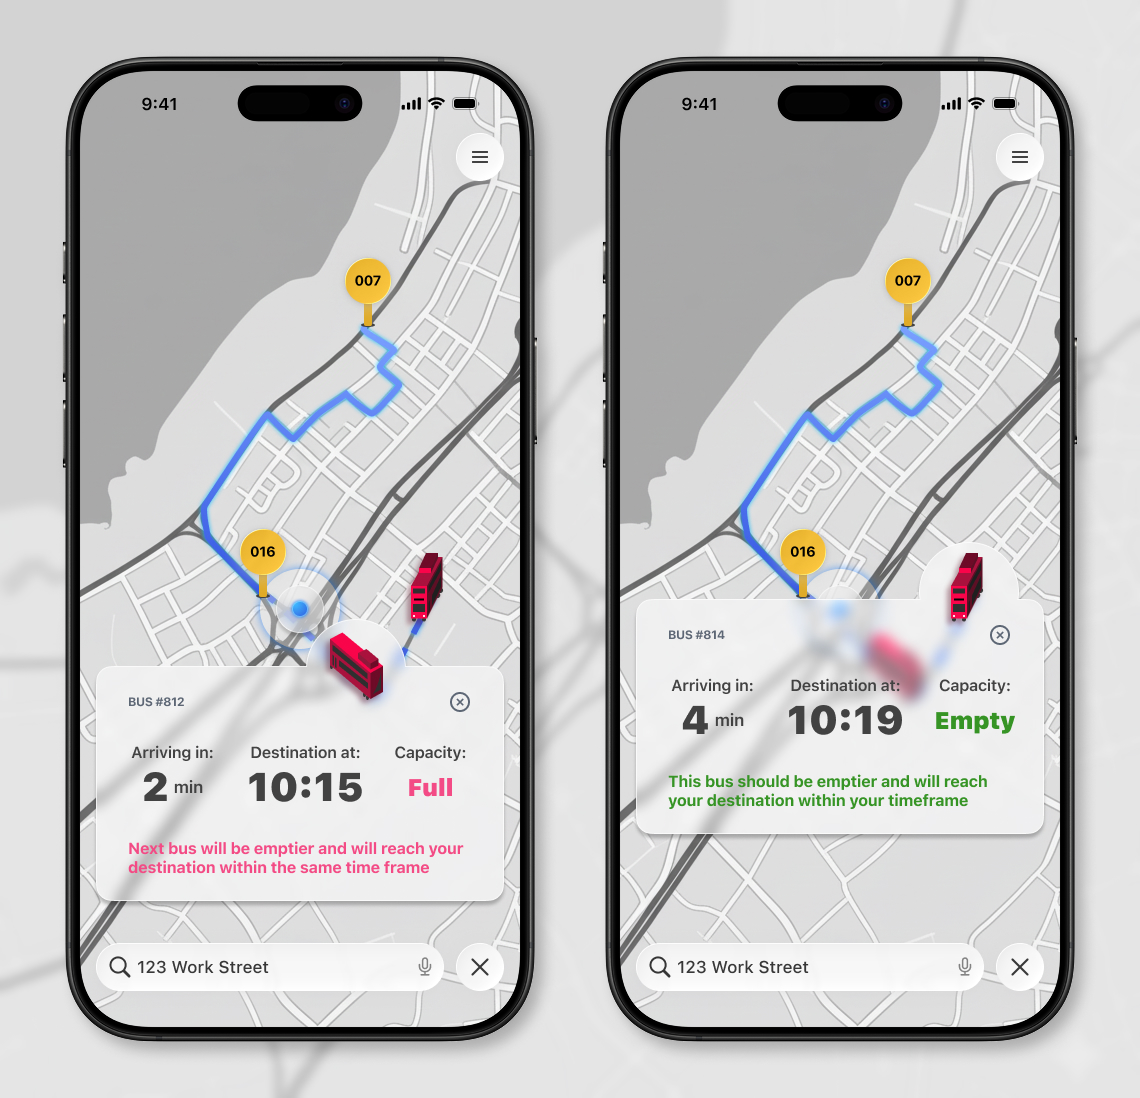
Screen 3 (left): On tapping a specific bus, the app will inform when it will arrive at the users stop, the time it will reach the users destination, and how the bus is full. The app then suggests the user to take the bus after that one as it’s emptier and will arrive within the specified time frame.
Screen 4 (right): User taps on the second bus and is presented with more information.
The Conclusion
Thanks to rich analytical data (both private and open) and in-depth examining of the same, our team was able to come up with a possible solution to the problem of users avoiding crowded buses while also arriving at their destination at a specific time.
While there might be some technical considerations, initial prototype user tests had overwhelming positive feedback when presented guerrilla-style to public transport users.
There is still important technical considerations to be taken into account, such as the increase on API requests which could result in server overload during peak hours. The retrieval of third party API data could also result in additional costs for the client. Further tests will have to be done to properly calculate the ROI of implementing this feature, which could be an additional complication as the client would have to figure out to quantify their users happiness and levels of stress.
Overall, the client and our team are confident that despite any additional costs, the happiness of public transport users and the better distribution of bus loads resulting from the app usage could result in the reduction of overall traffic jams in the city while also reducing the need for extra buses in the long term.
References
- [1] – Cantwell, Mairead, et al. 2009. Examining the Factors that Impact Public Transport Commuting Satisfaction. Journal of Public Transportation, 12 (2): 1-21.
- [2] – Lyons, G. And Chatterjee, K. 2007. A Human Perspective on the Daily Commute: Costs, Benefits and Trade‐offs, Transport Reviews, 28:2, 181-198
- [3] – Google Maps Platform – Traffic, Transit, and Bicycling Layers. Retrieved on 25th of November 2019 from web.
ALL INFORMATION ON THIS PAGE IS CONFIDENTIAL – PLEASE DO NOT REDISTRIBUTE